Quick Guide
"Top" Page
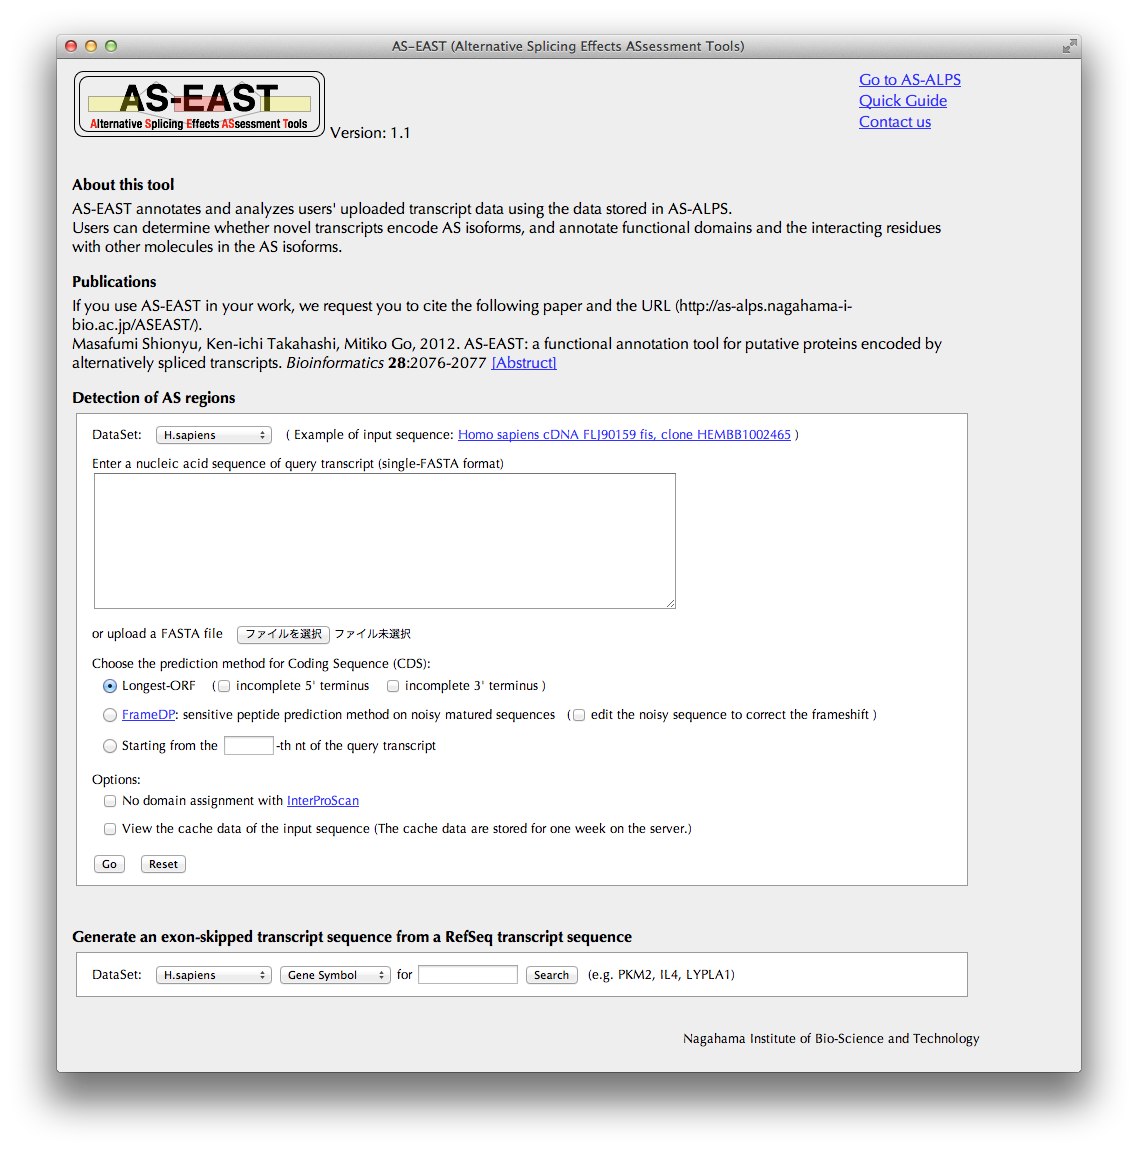
Detection of AS regions
A transcript sequence ("query transcript") to be uploaded in this section will be annotated in terms of AS.
- DataSet:
- the query transcript will be compared with related transcripts in a selected dataset of the AS-ALPS database.
- Prediction methods for Coding Sequence (CDS):
- A probable CDS of the query transcript will be predicted with a selected method. In the case of the first method, check relevant checkboxes if you known that the query transcript has incomplete 5' and /or 3' termini. For the third method, enter a nucleotide number in the textbox, from which the query transcript will be translated.
- Options:
-
You can choose to skip the domain assignment process with InterProScan, which takes a long time.
You can choose to view cache data of the same sequence as the query previously annotated by AS-EAST in order to save time.
Clicking the "Go" button brings you to the "Mapping summary" page.
Generate an exon-skipped transcript sequence from a RefSeq transcript sequence
If you want to generate an exon skipped transcript sequence from a known transcript sequence, search the AS-ALPS database for known transcript sequences by Gene Symbol (e.g., MAPKI), Transcript ID in RefSeq (e.g., NM_002745), or Entrez Gene ID (e.g., 5594). The result will appear below in the same page. Go on to the next process.
"Mapping summary" Page
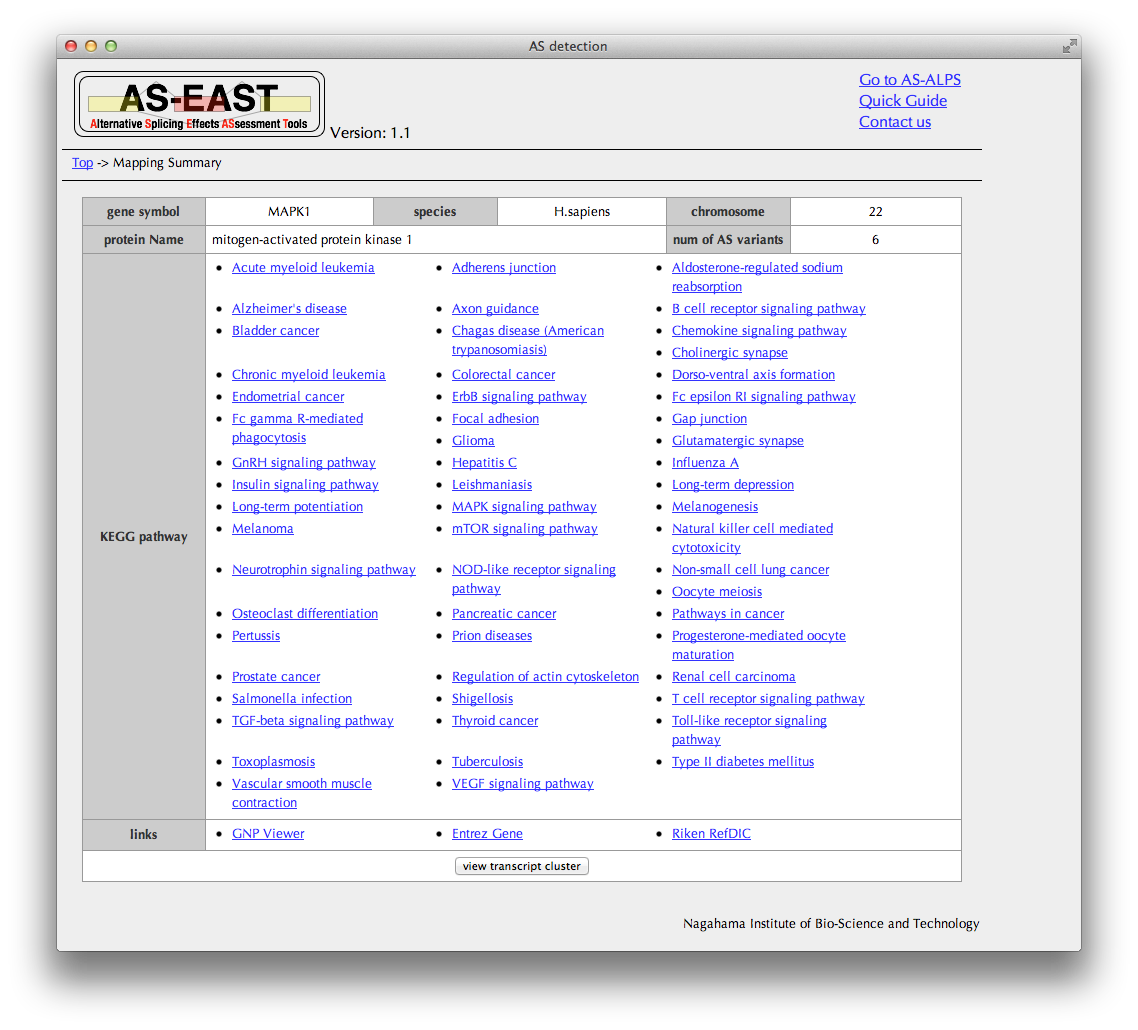
This table of search results shows, in the same format as in the AS-ALPS database, information of the transcript cluster whose mapping location overlaps with that of the query transcript.
Clicking the "view transcript cluster" button brings you to the "Transcript cluster" page.
"Transcript cluster" Page
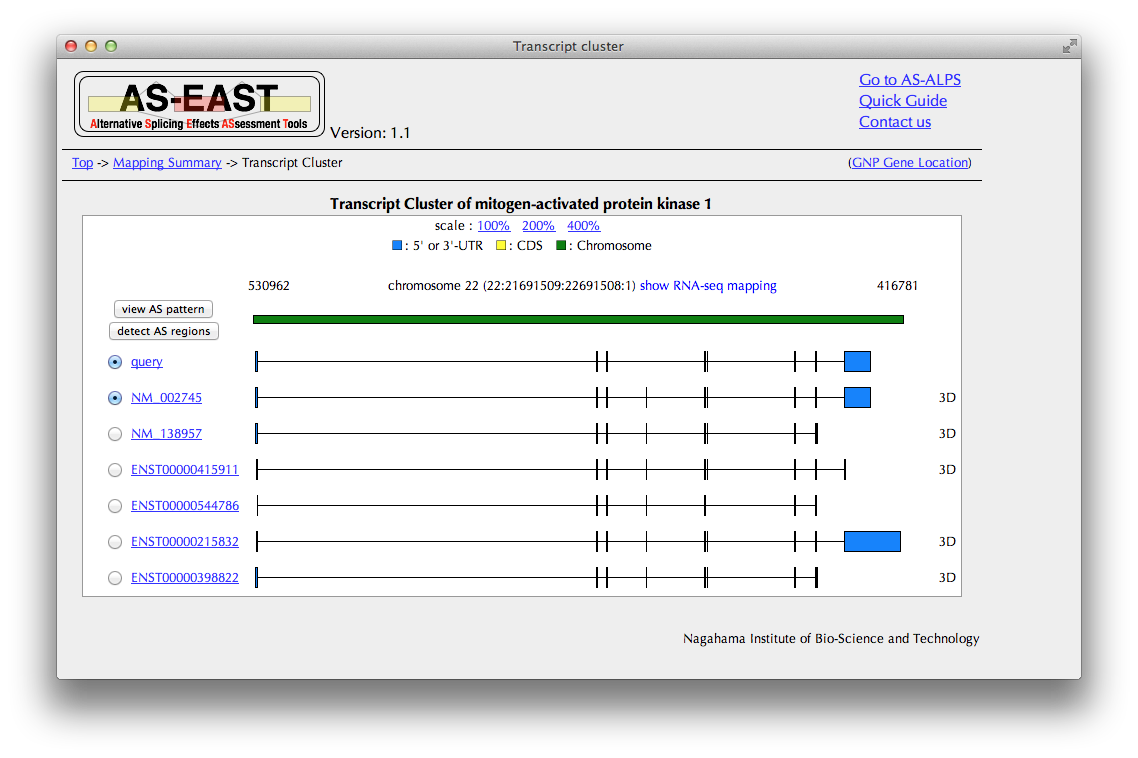
You can see here a schematic representation of alignments between a chromosome and transcripts.
In the case of human data, you can see a mapping result of RNA-Seq data by clicking the "show RNA-seq mapping" button.
If you want to see details of the query transcript, click the link of "query", going to "Trascript details."
Select one transcript as a reference to be compared with the query transcript.
If you want to know what pattern of AS is detected from the comparison of the query and reference, click the "view AS pattern" button, leading to the "AS pattern" page.
Click the "detect AS regions" button, bringing you to the "AS regions" page.
"AS regions" Page
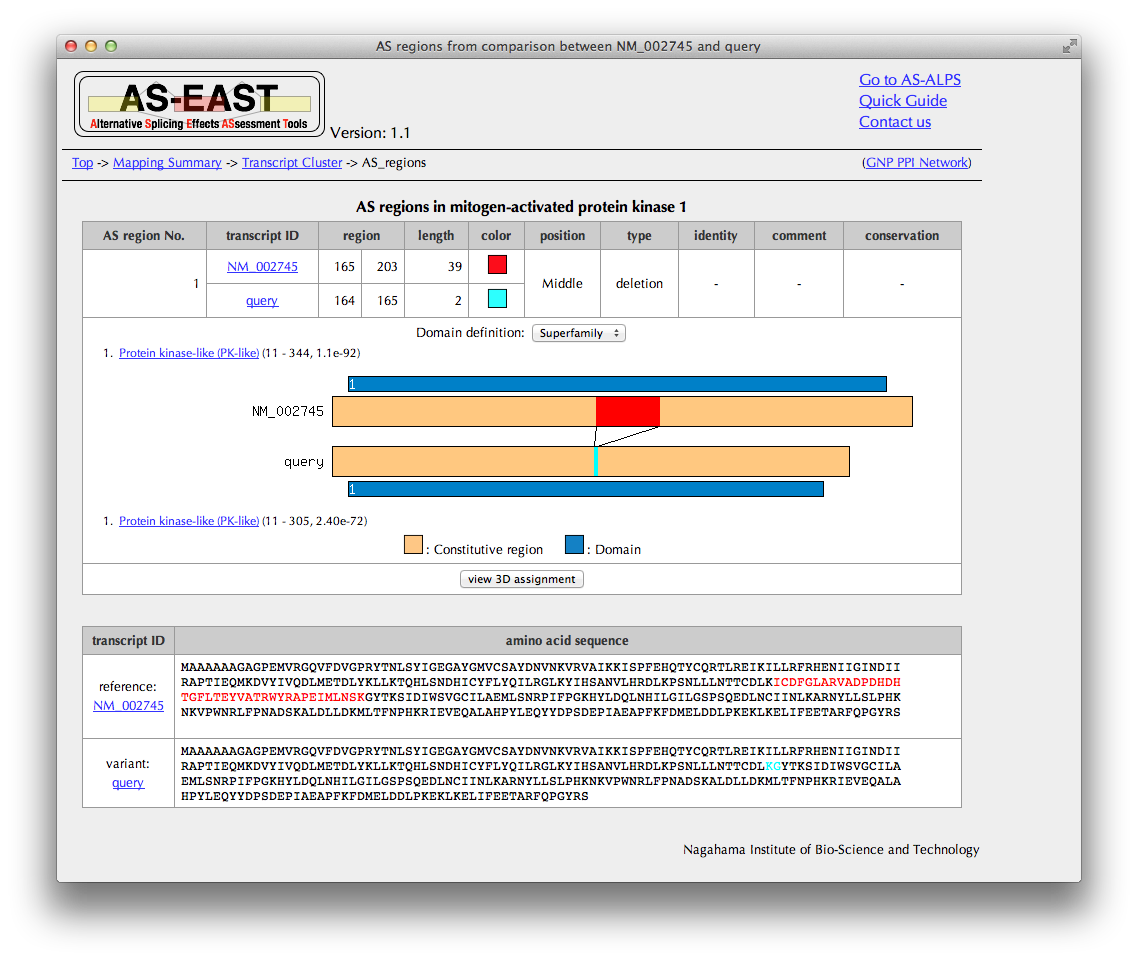
You can see here AS regions detected by a comparison between the amino acid sequences derived from the query and reference transcripts.
In the case of the substitution type, the sequence identity of AS regions mutually replaced is shown if comparable.
Click the "view 3D assignment" button, if available, to show results of 3D structure assignment to AS regions.
"3D assignments" Page
Summary of assignment
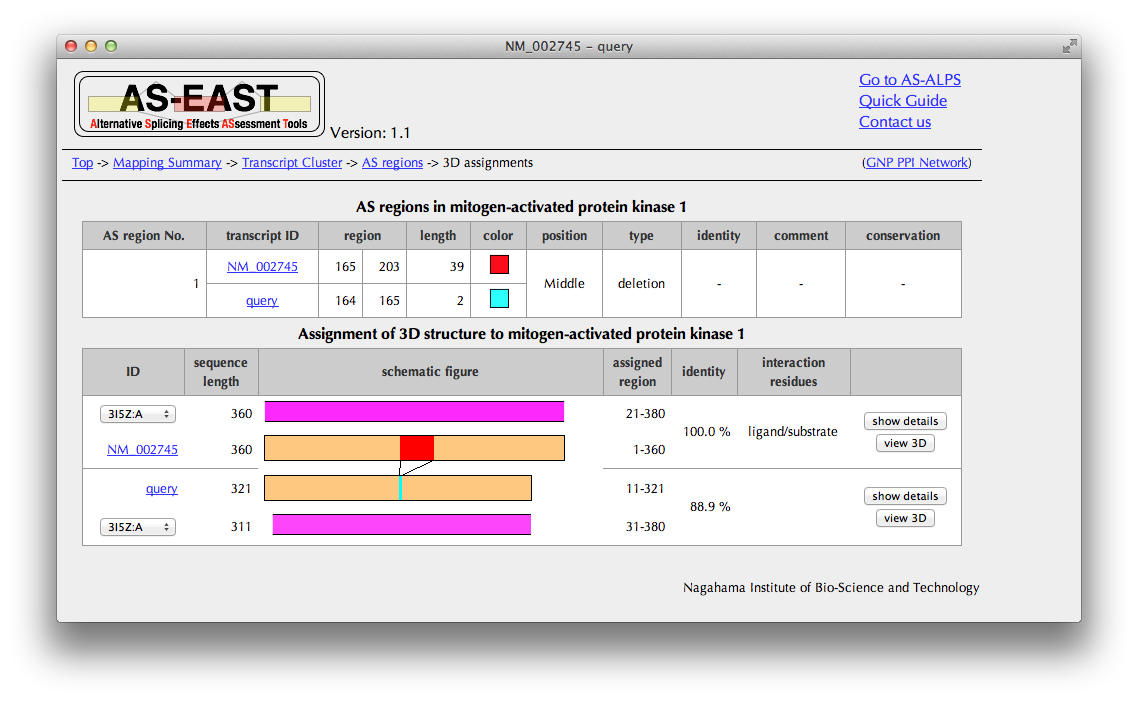
You can see here a schematic representation of alignments between a pair of the amino acid sequences of the query and reference and PDB entries with sequence identities.
You can also check in the "annotation" column whether each PDB entry includes interaction information.
If you want to see more PDB entries with low sequence identities, change the PDB ID.
Click a button of "show details" in the rightmost columnt to see detailed interaction information extracted from the structure data.
Click a button of "view 3D" in the rightmost column to see AS regions on the 3D structure.
Details of assignment
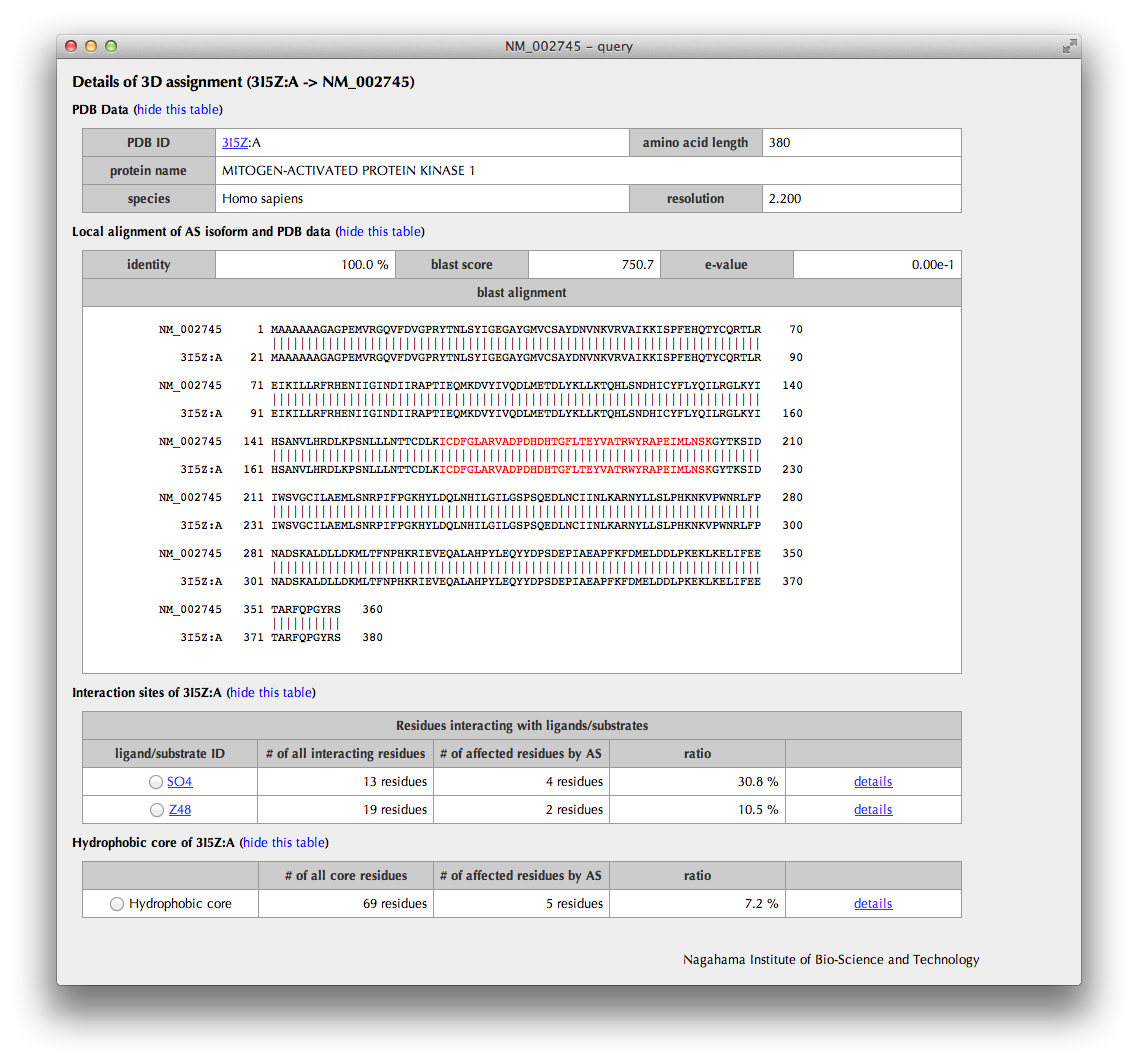
The upper half of the page summarizes the information of the PDB entry assigned to the AS isoform. The sequence alignment from the BLASTP result is also shown; the AS regions are colored by their types (deletion: red, insertion: cyan, substitution: violet).
The lower half of the page summarizes the annotations such as interaction sites and hydrophobic core residues obtained from the assigned 3D structure.
By clicking a radio button, interaction sites or hydrophobic core residues are shown in the sequence alianment. Moreover, a bar figure with interaction sites or hydrophobic core residues depicted with triangles, in which AS regions are colored by their types (deletion: red, insertion: cyan, substitution: violet) and constitutive regions are in light orange, are shown.
"AS regions on 3D structure" Page
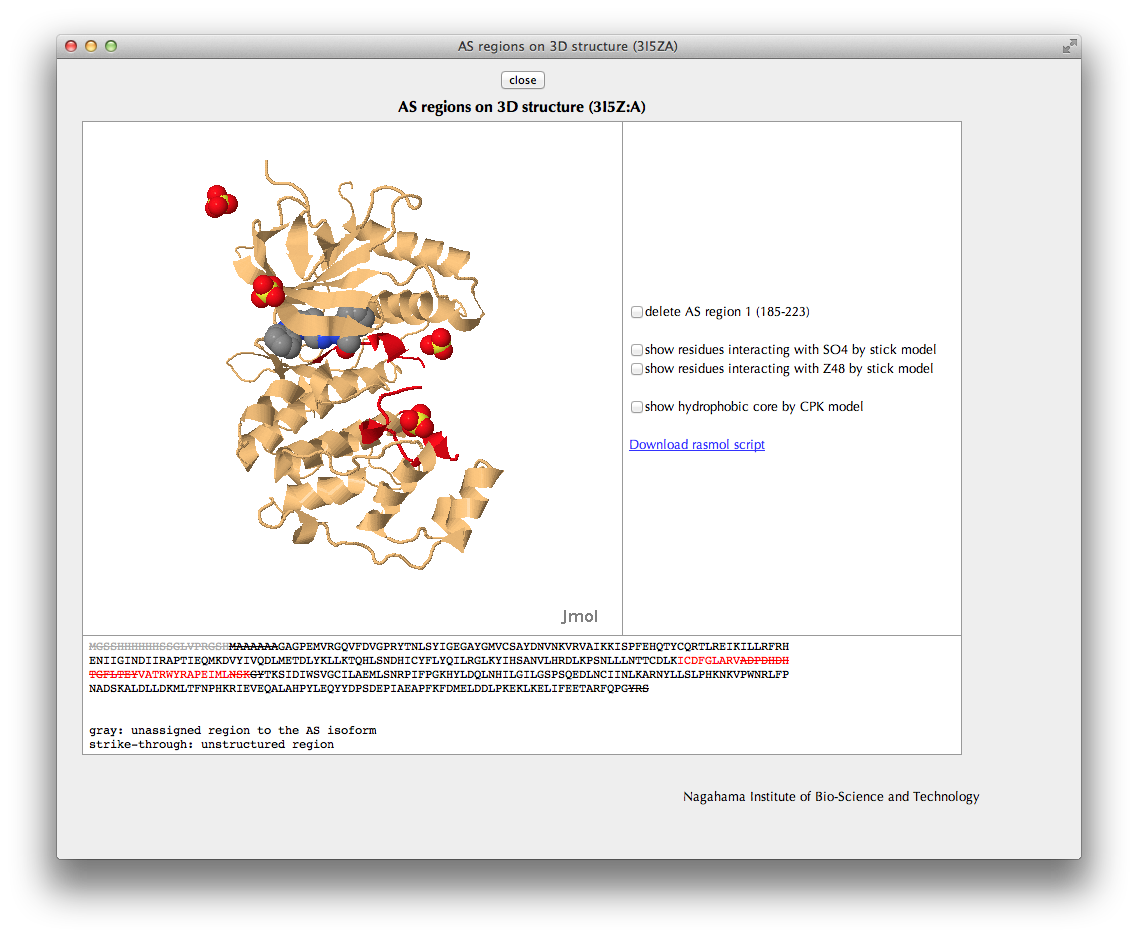
In the Jmol viewer, the relevant protein chain including the AS regions is shown in the same colors as in the bar figures.
You can check locations of interaction sites or hydrophobic core residues by clicking check boxes.
"Exon-skipped transcript generation" Page
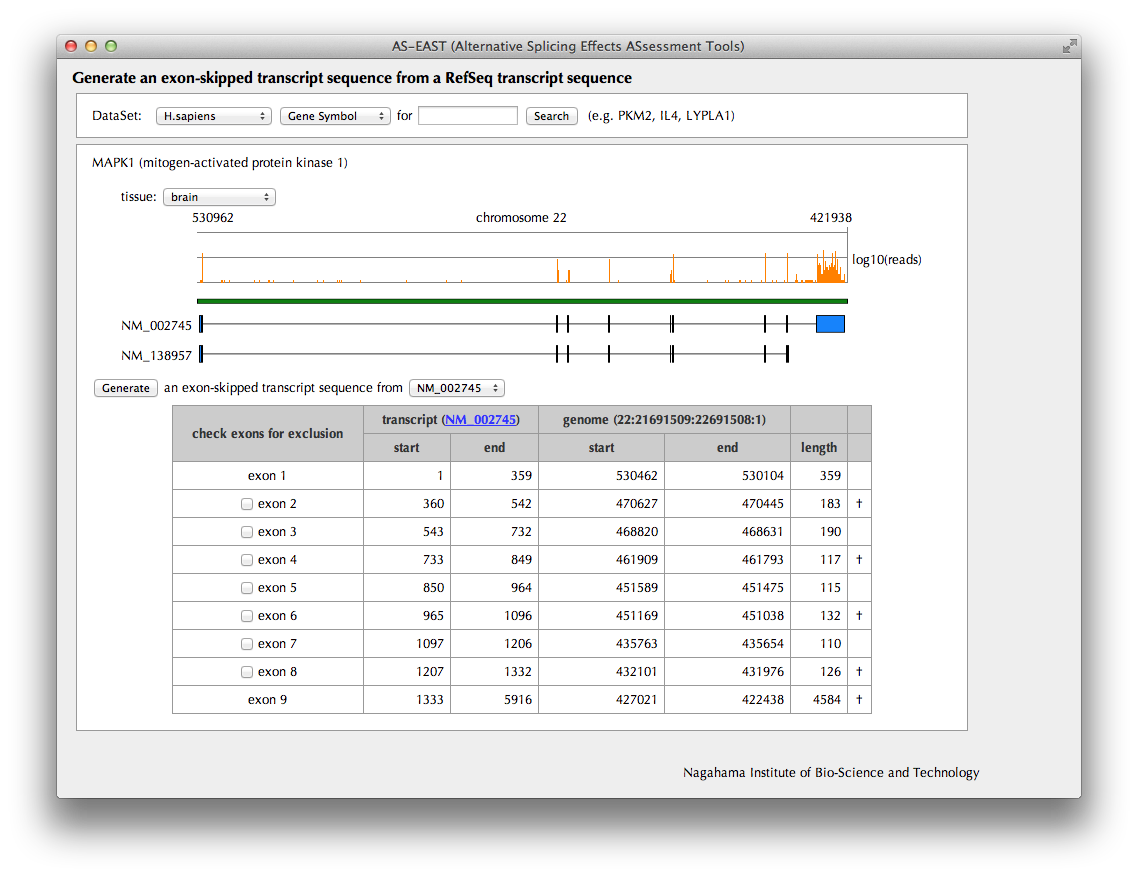
Splicing patterns of RefSeq transcripts stored in the AS-ALPS database are shown. Select one of the transcripts as a template from which an exon-skipped transcript will be generated. Choose exons to be excluded by checking corresponding checkboxes. A dagger is shown in the rightmost column for an exon whose length is a multiple of three nucleotides.
In the human dataset, the mapping results of RNA-Seq data from Wang et al. (Wang et al., 2008 Nature, 456:470-476) are shown at the top of the schematic figure, which may suggests which exon tends to be skipped in a certain tissue.
Click the "Generate" button.
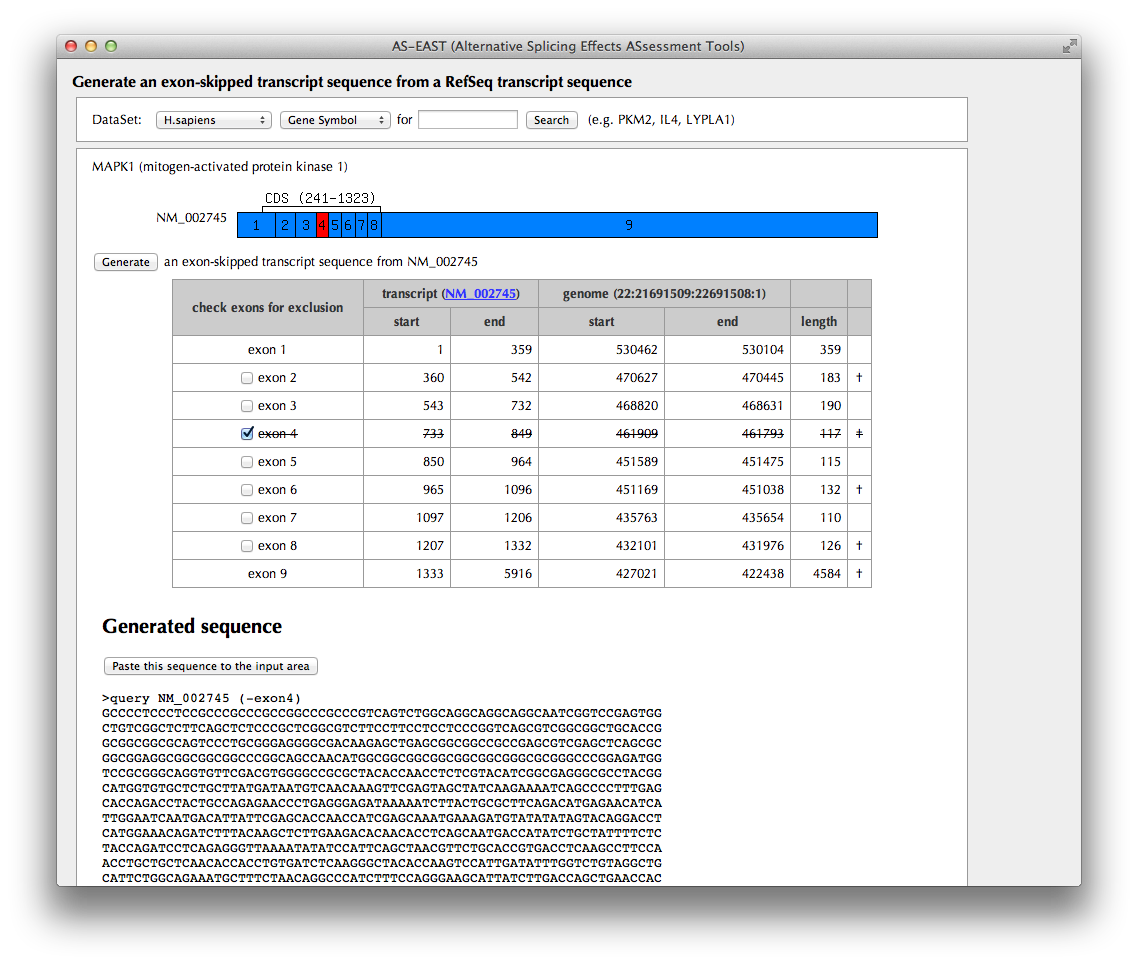
A schematic figure of the template transcript is shown. The selected exon in the previous page is shown in red box.
The exon-skipped transcript sequence generated from the template transcript is shown in the bottom of the page.
If you click "Paste this sequence to the input area" button, the FASTA-formatted transcript sequence is input to the textbox of the top of the page.
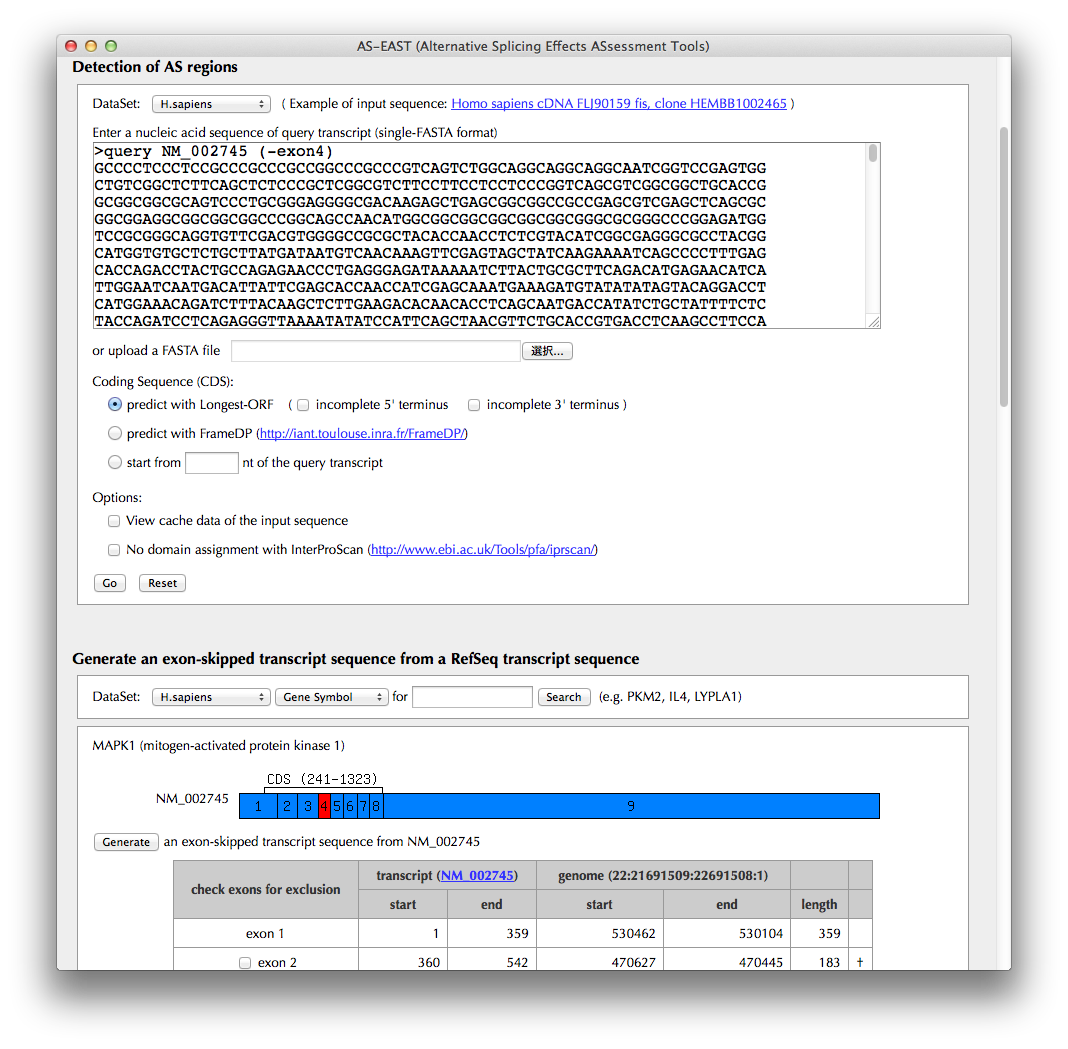
Go back to the explanation of "Top Page."
"Transcript details" Page
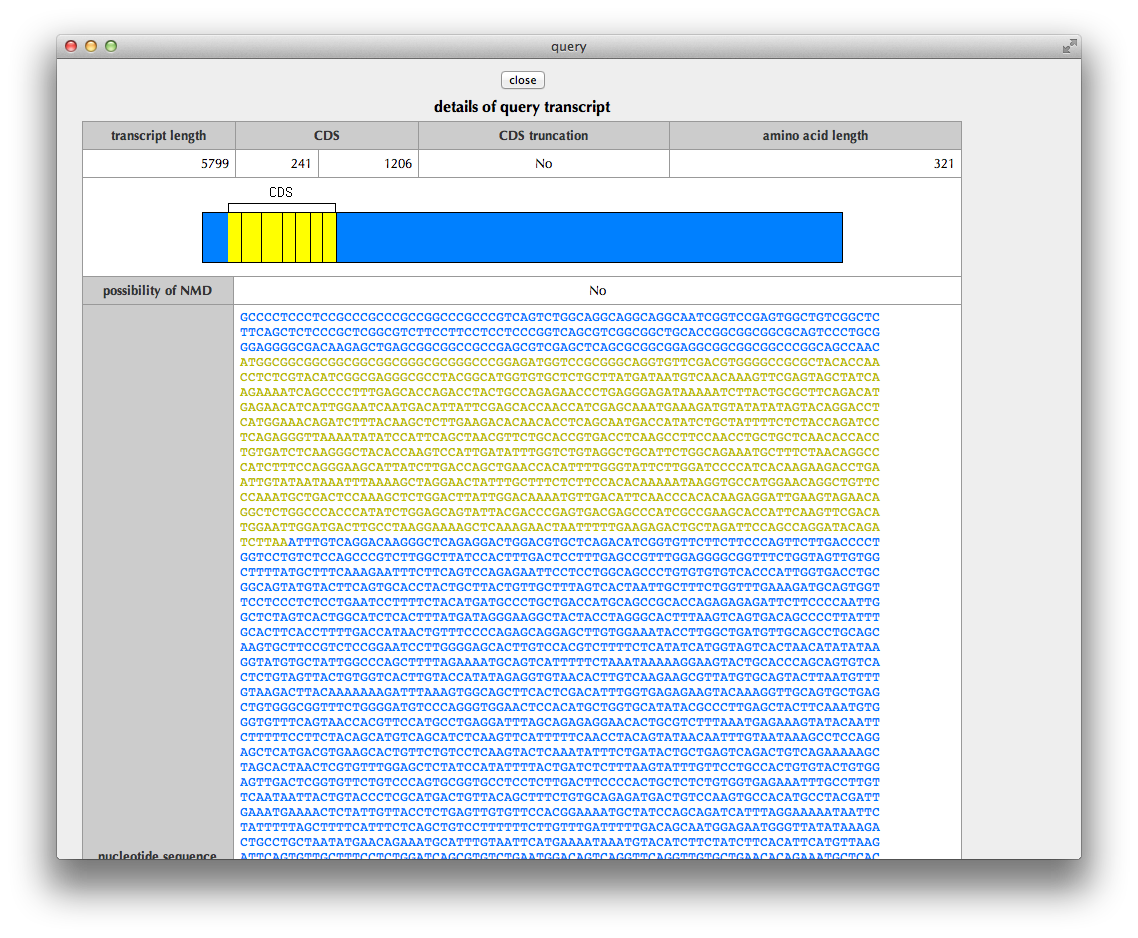
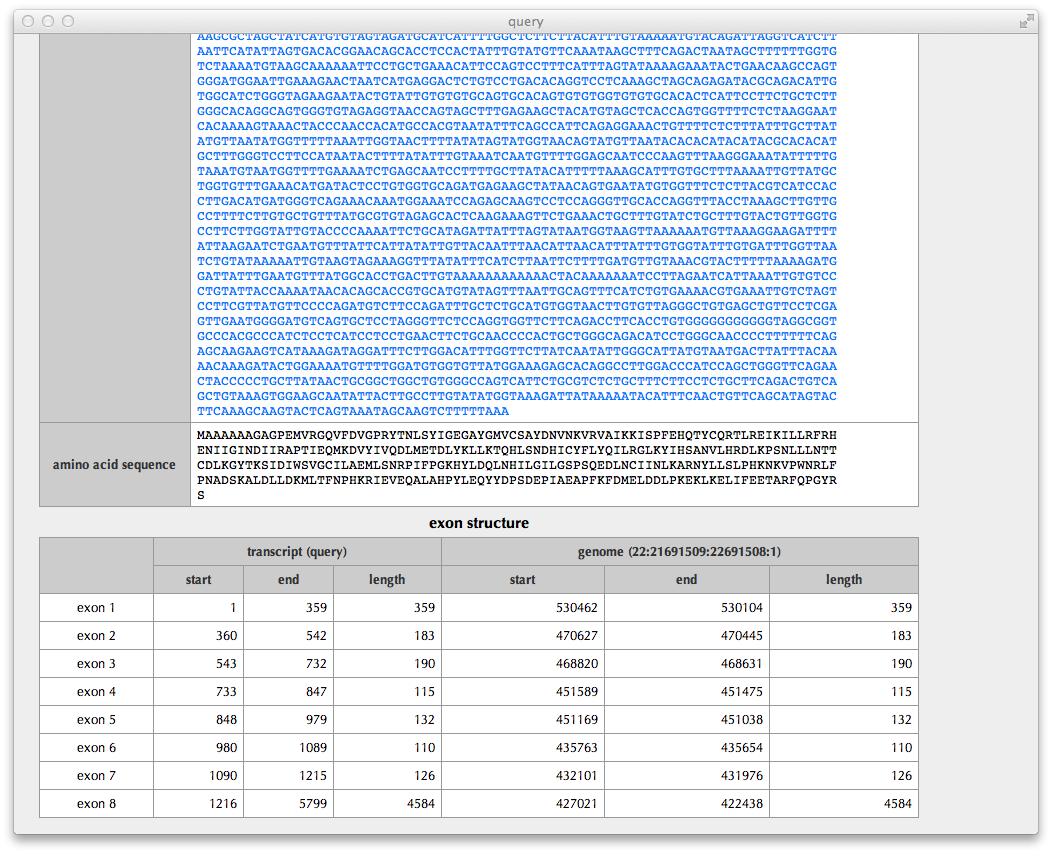
This page shows details of the query transcript: the region of CDS (coding sequence), the status of CDS truncation at the 5’ and 3’ termini, a possibility of NMD (nonsense-mediated mRNA decay) judged from the sequence, the nucleotide sequence of transcript, the translated amino acid sequence and the exon structure.
Go back to the explanation of "Transcript cluster" page.
"AS pattern" Page
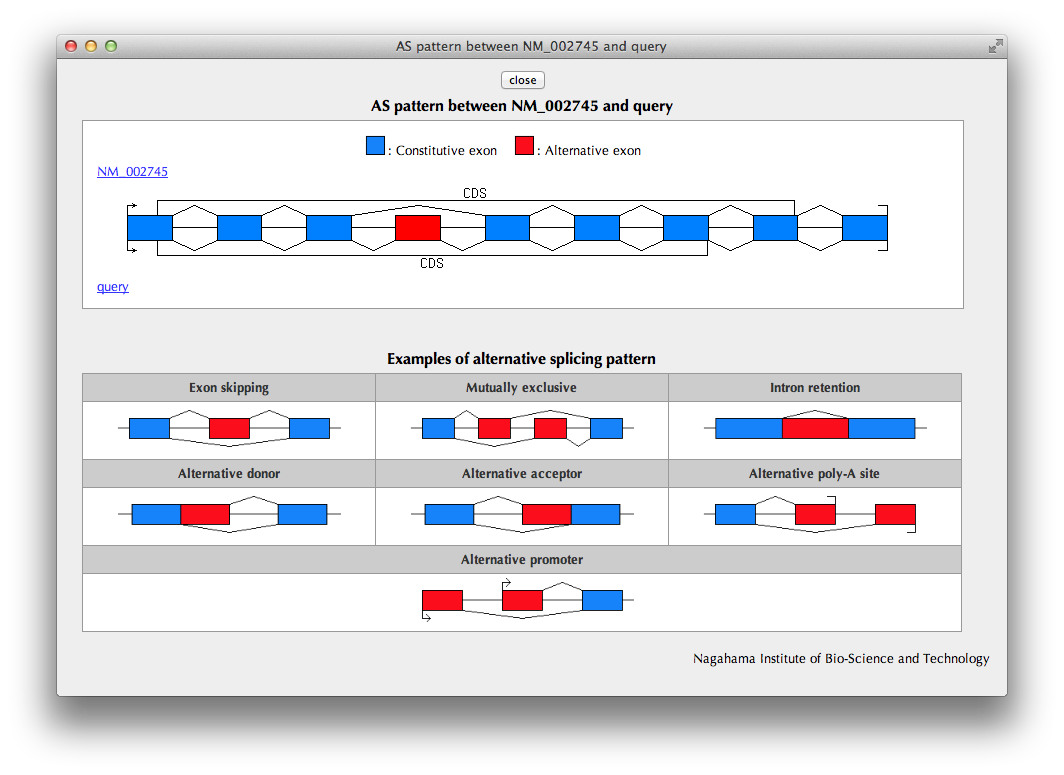
A pattern of alternative exon usage ("AS pattern") of the query transcript in comparison with the reference transcript selected by the user in the previous page is schematically shown.
A catalog of AS patterns is shown below for your reference.
Go back to the explanation of "Transcript cluster" page.