Quick Guide
"Top" Page
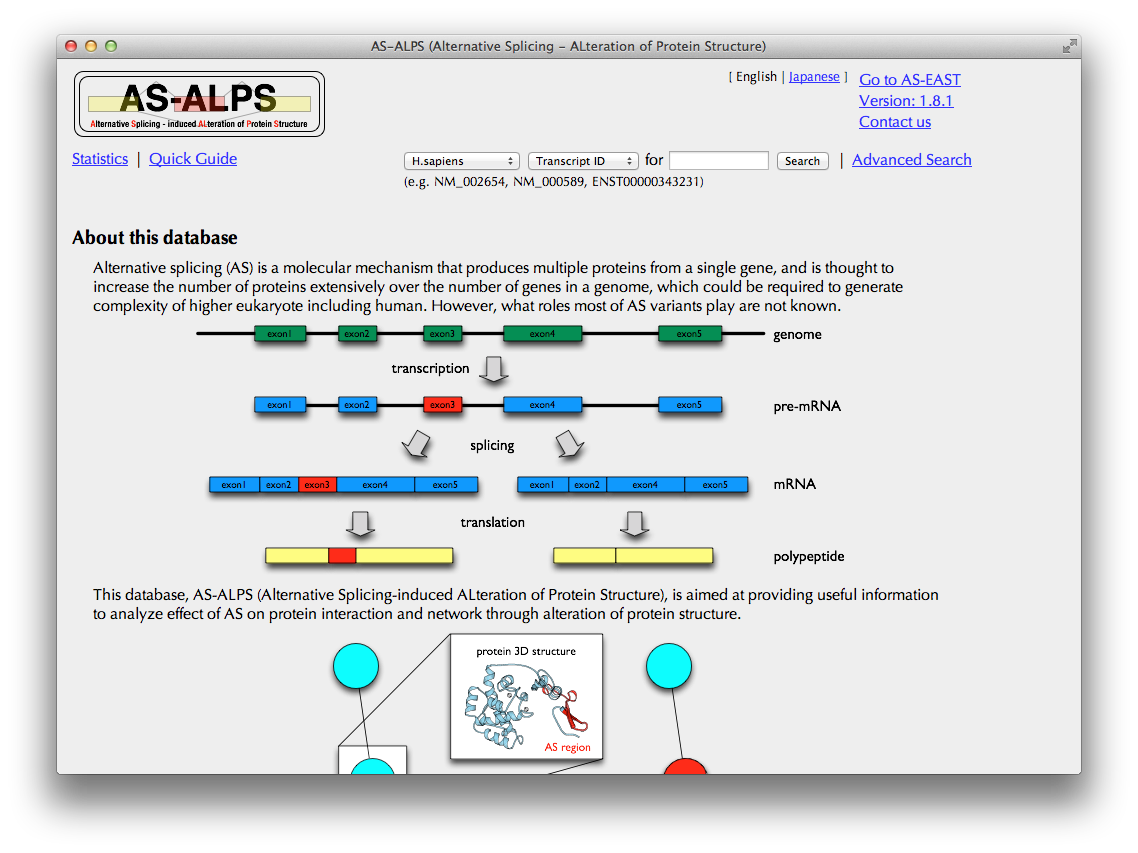
Quick Search
On the search form in the top, you can search for a cluster of transcripts produced by AS from a single gene, in 6 species (H. sapiens, M. musculus, D. melanogaster, C. elegans, A. thaliana and O. sativa), specified by Transcript ID in RefSeq, Ensembl, TAIR or TIGR (e.g., NM_000589), or Gene Symbol (e.g., IL4), or Entrez Gene ID (e.g., 3565). You can also search for AS isoforms from Swiss-Prot database specified by ID in Swiss-Prot (e.g., PCLO_RAT), or Gene Symbol (e.g., pclo).
Clicking the "Search" button brings you to the Search Result page.
Alternatively, you can move to "Advanced Search" page by clicking the hyperlink on the right of the search box.
Search Result Page
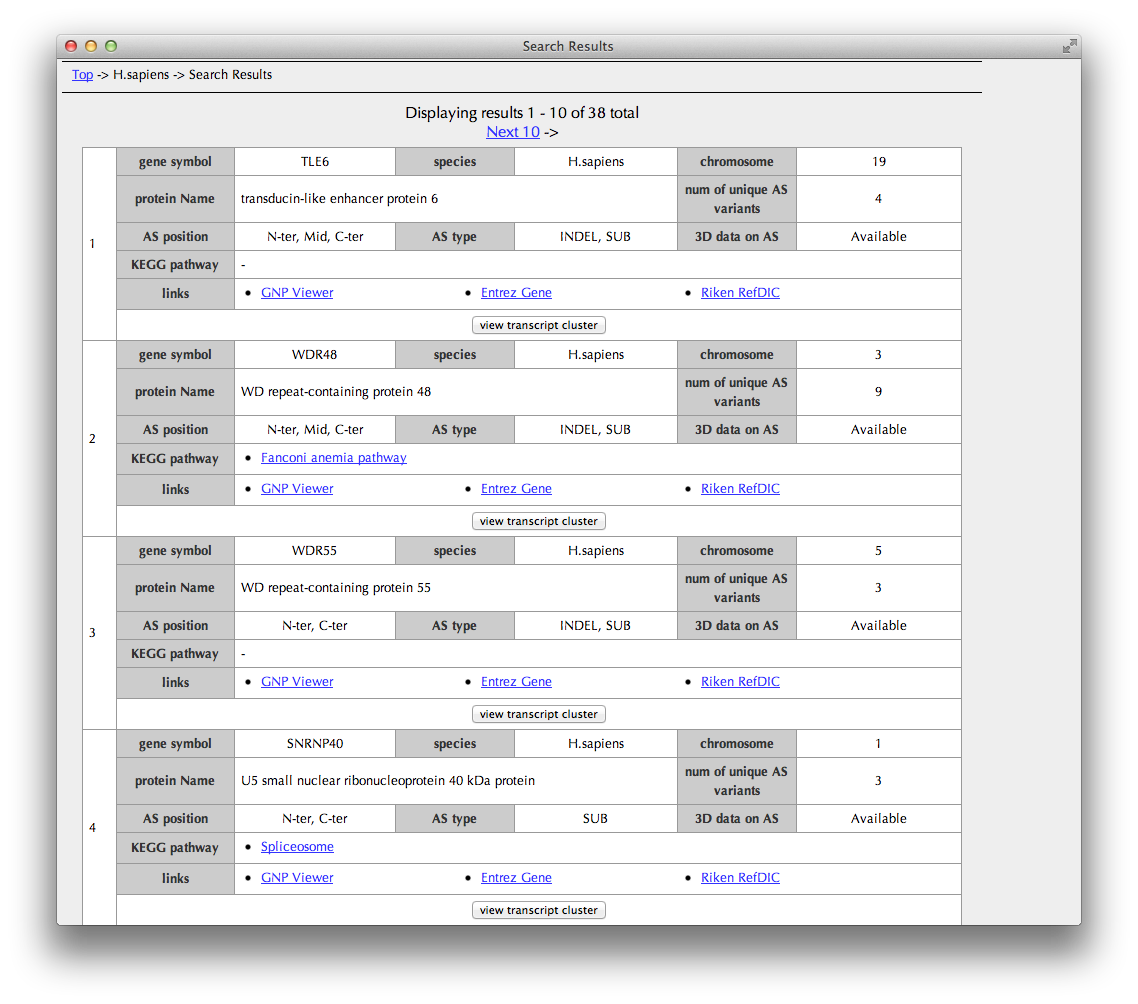
In this table of search results, annotated information is briefly shown for each cluster of transcripts produced by AS from a single gene.
Clicking the "view transcript cluster" button brings you to the "Transcript cluster" page.
When you click the links in the KEGG pathway column, you can see AS information of the other genes belonging to the same pathway.
"Transcript cluster" Page
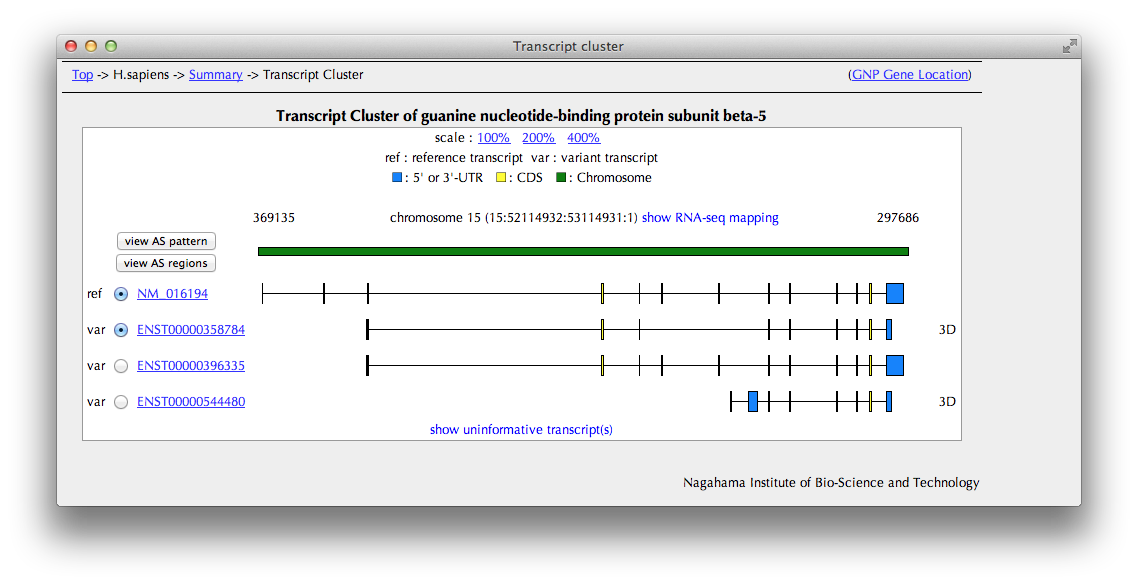
You can see here a schematic representation of alignments between a chromosome and transcripts.
In the case of human data, you can see a mapping result of RNA-Seq data by clicking the [show RNA-seq mapping] button.
If you want to see details of the transcripts, click the links of "ref" or "var", going to "Transcript details".
AS regions are detected by a comparison between a pre-defined reference transcript and one of other variant transcripts.
Select one variant transcript in the leftmost column and click the "view AS regions" button to view the "AS regions" page.
By clicking the [view AS pattern] button, you can also see the "AS pattern" page.
"AS regions" Page
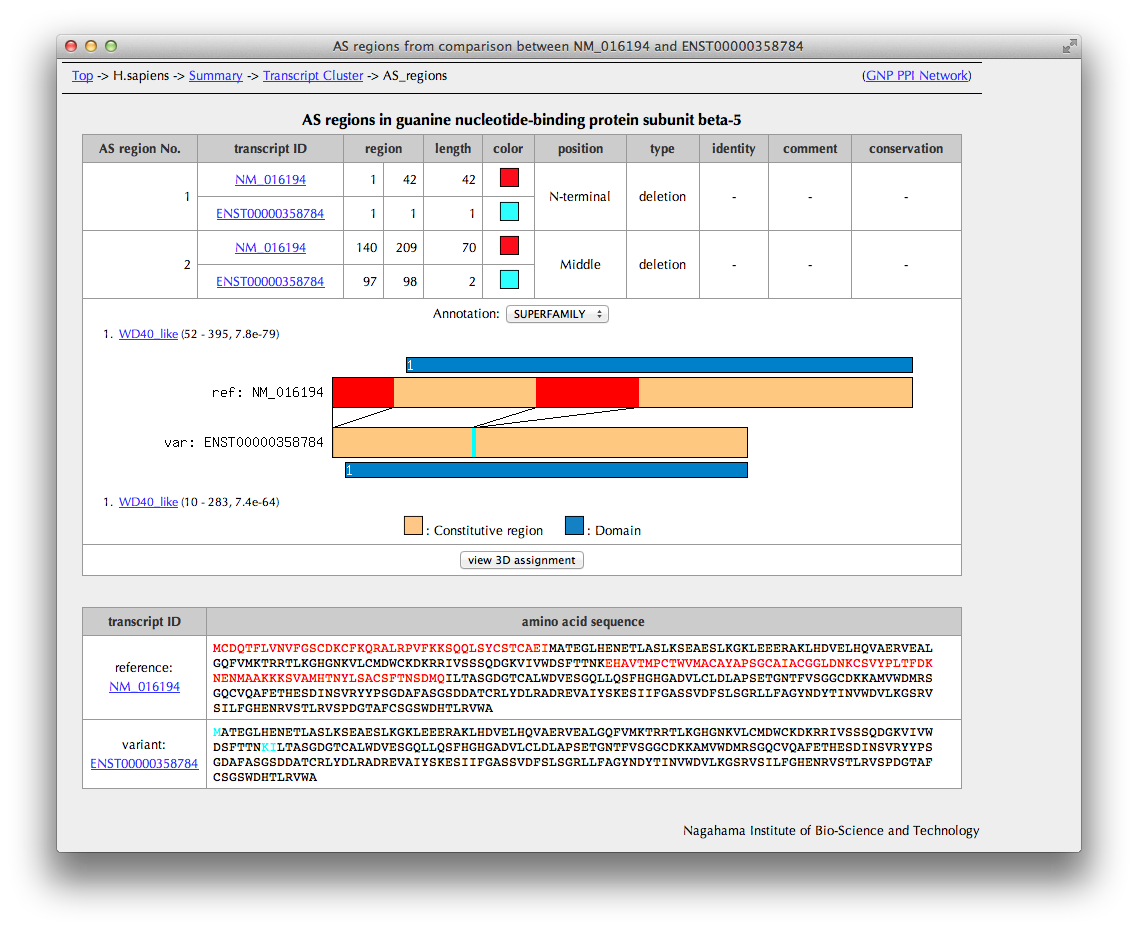
You can see here AS regions detected by a comparison between a pre-defined reference transcript and one variant transcript selected in the previous page.
In the case of the substitution type, the sequence identity of AS regions mutually replaced is shown if comparable.
Click the [view 3D assignment] button, if available, to show results of 3D structure assignment to AS regions.
"3D assignments" Page
Summary of assignment
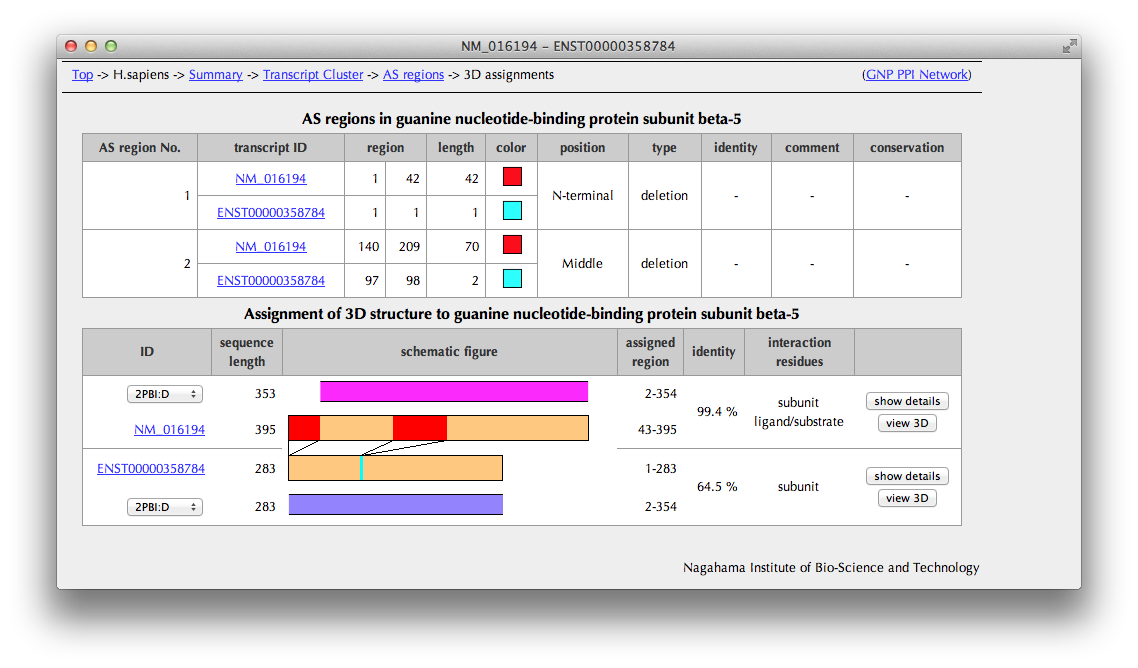
You can see here a schematic representation of alignments between a pair of the amino acid sequences of the reference and variant and PDB entries with sequence identities.
You can also check in the "interaction residues" column whether each PDB entry includes interaction information.
If you want to see more PDB entries with low sequence identities, change the PDB ID.
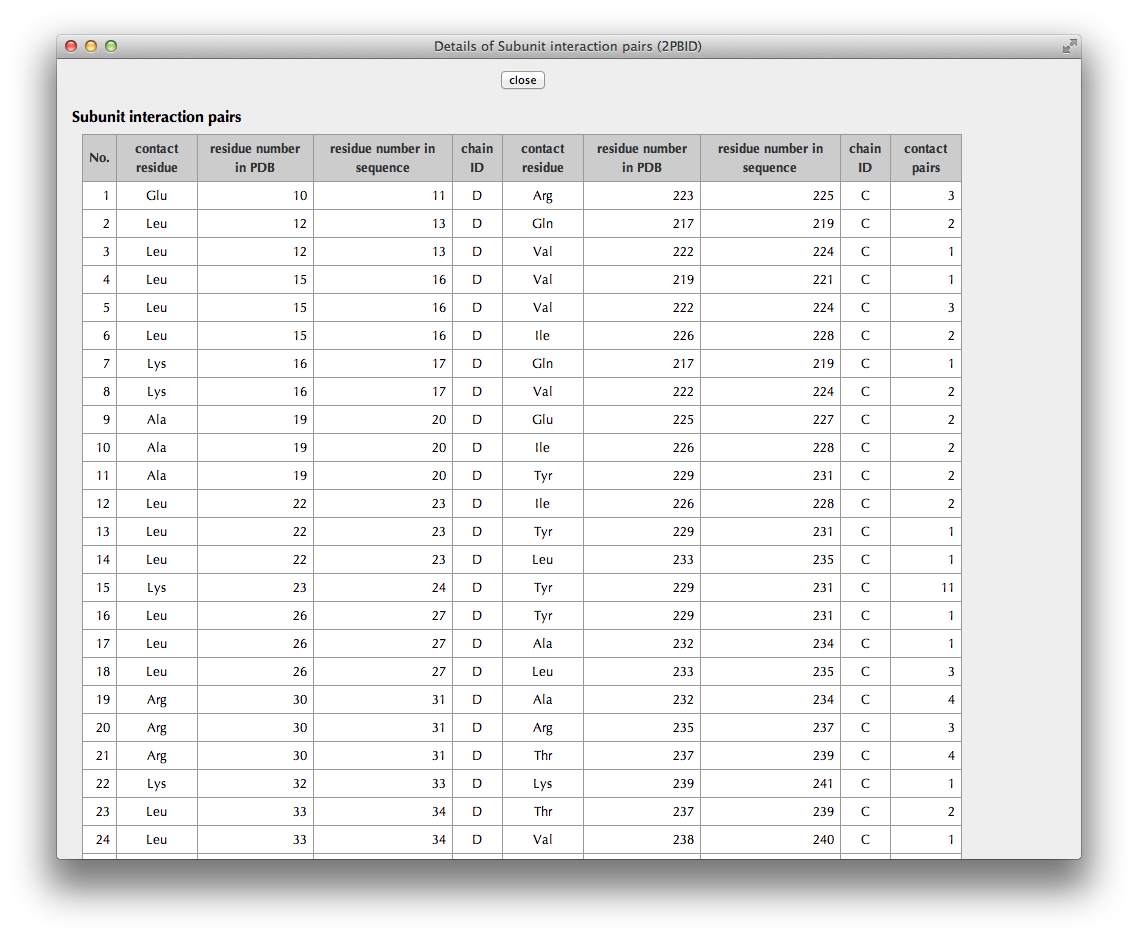
Click a button of [show details] in the rightmost column to see detailed interaction information extracted from the structure data.
Click a button of [view 3D] in the rightmost column to see AS regions on the 3D structure.
Details of assignment
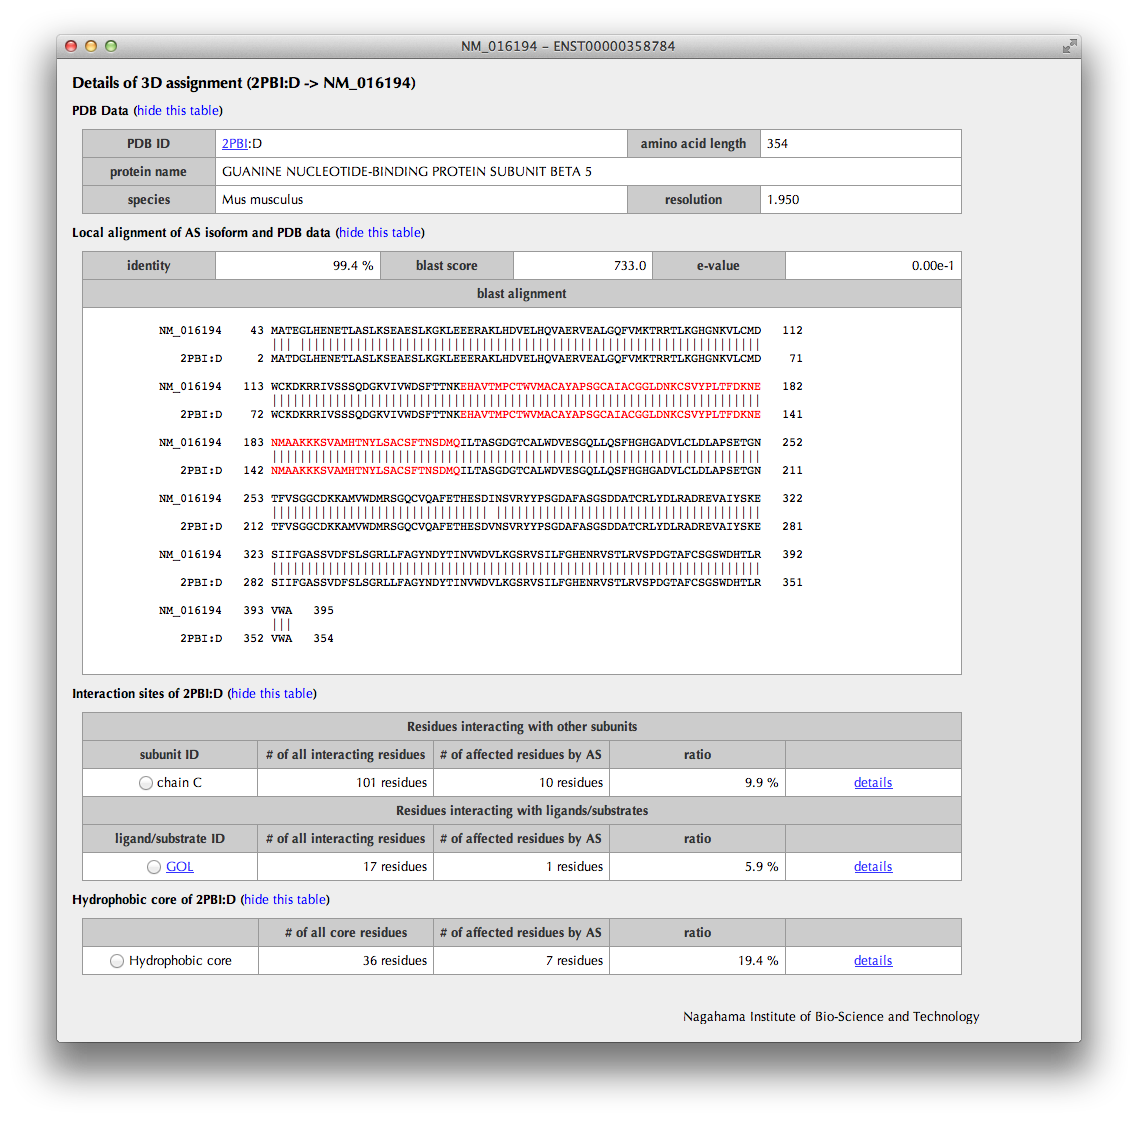
The upper half of the page summarizes the information of the PDB entry assigned to the AS isoform. The sequence alignment from the BLASTP result is also shown; the AS regions are colored by their types (deletion: red, insertion: cyan, substitution: violet).
The lower half of the page summarizes the annotations such as interaction sites and hydrophobic core residues obtained from the assigned 3D structure.
By clicking a "details" link, the information of the interaction sites and hydrophobic core residues is shown in the "Details" page.
By clicking a radio button, interaction sites or hydrophobic core residues are shown in the sequence alianment. Moreover, a bar figure with interaction sites or hydrophobic core residues depicted with triangles, in which AS regions are colored by their types (deletion: red, insertion: cyan, substitution: violet) and constitutive regions are in light orange, are shown.
"AS regions on 3D structure" Page
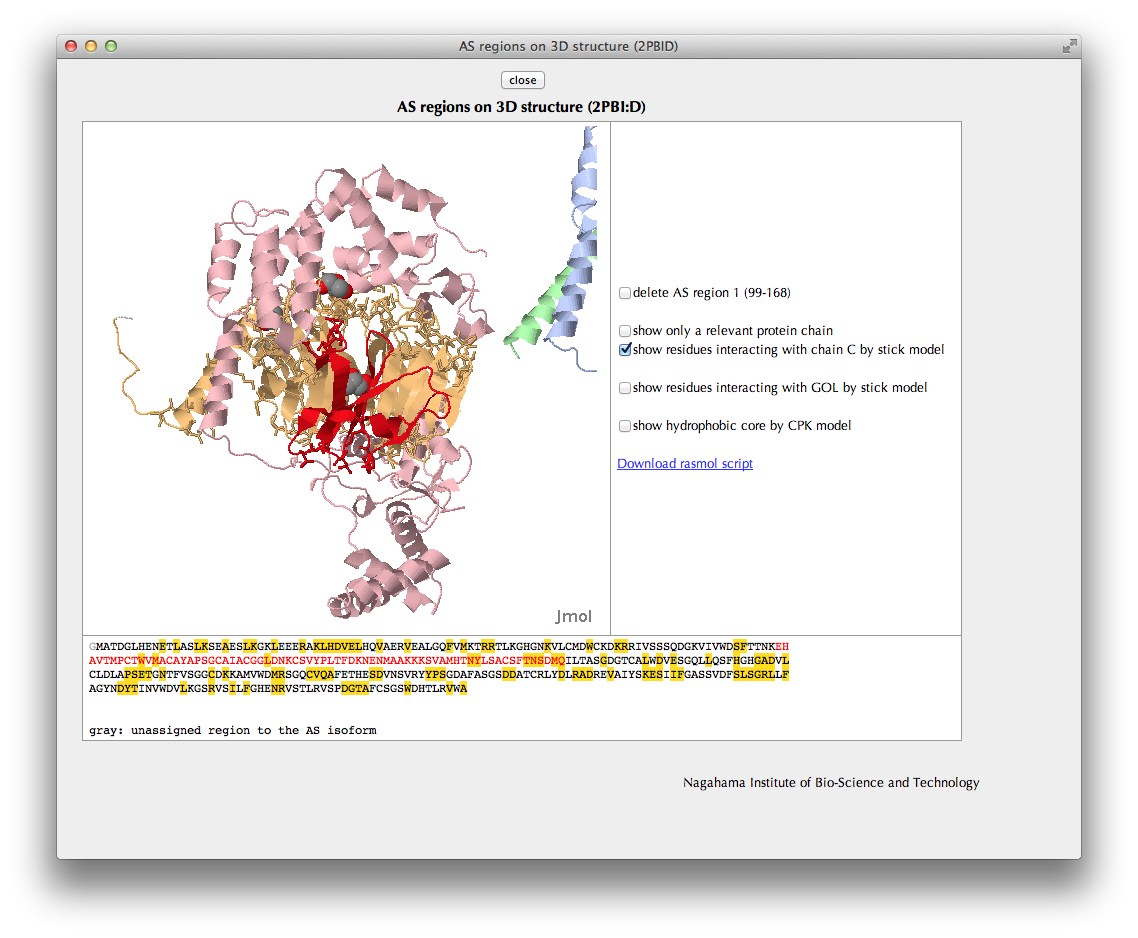
In the Jmol viewer, the relevant protein chain including the AS regions is shown in the same colors as in the bar figures.
You can check locations of interaction sites or hydrophobic core residues by clicking check boxes.
"Advanced Search" Page
Search by annotation
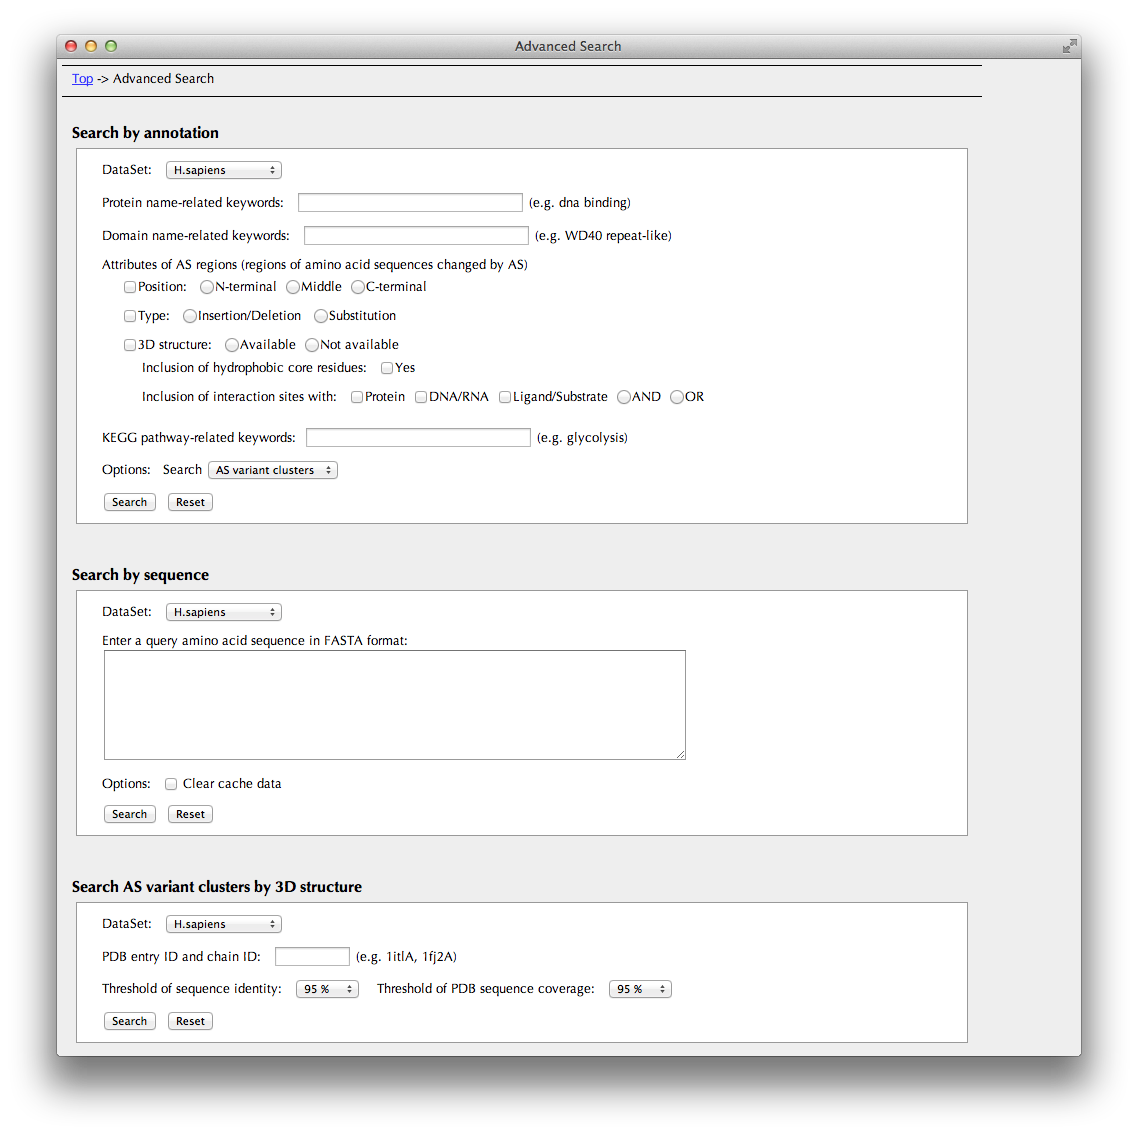
You can search AS variant clusters by a combination of the search conditions below.
- dataset (6 species or Swiss-Prot)
- protein name
- domain name
- attribution of AS regions:
- position
- type
- if 3D info is available,
- whether AS regions include hydrophobic core residues.
- what kind of interaction sites AS region include
- KEGG pathway name
Clicking the [Search] button brings you to the Search Result page.
Search by sequence
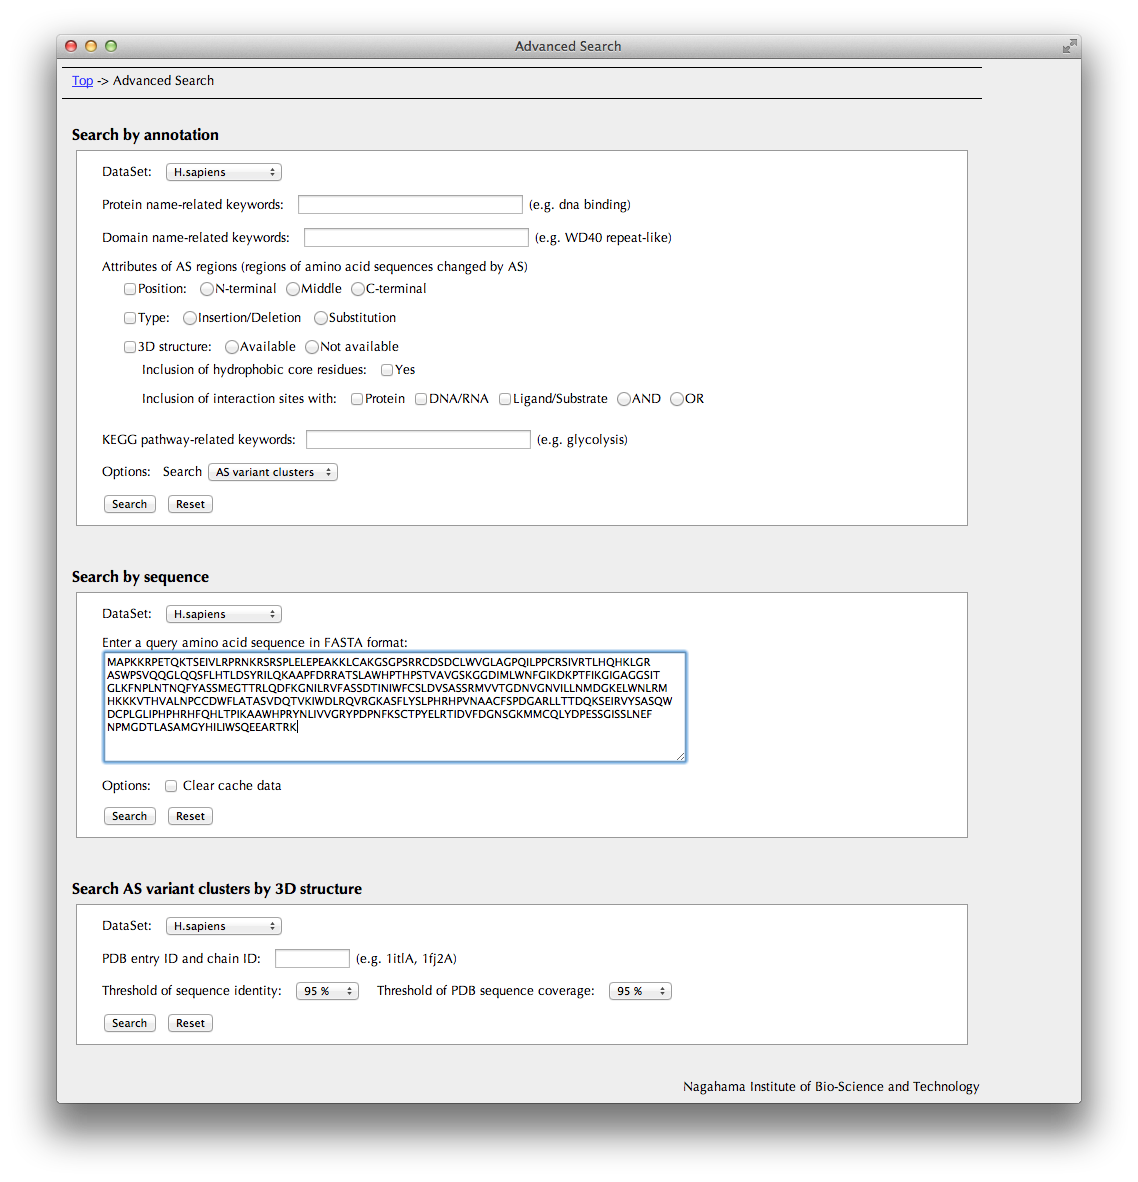
You can search search entries in this database by amino acid sequence. The search engine is FASTA.
Clicking the [Search] button brings you to the "FASTA Search Results" page.
Search AS variant clusters by 3D structure
You can also search entries in this database by PDB ID of 3D structure data assigned to the AS isoform.
Clicking the [Search] button brings you to the "Search Result" page.
"FASTA search result" Page
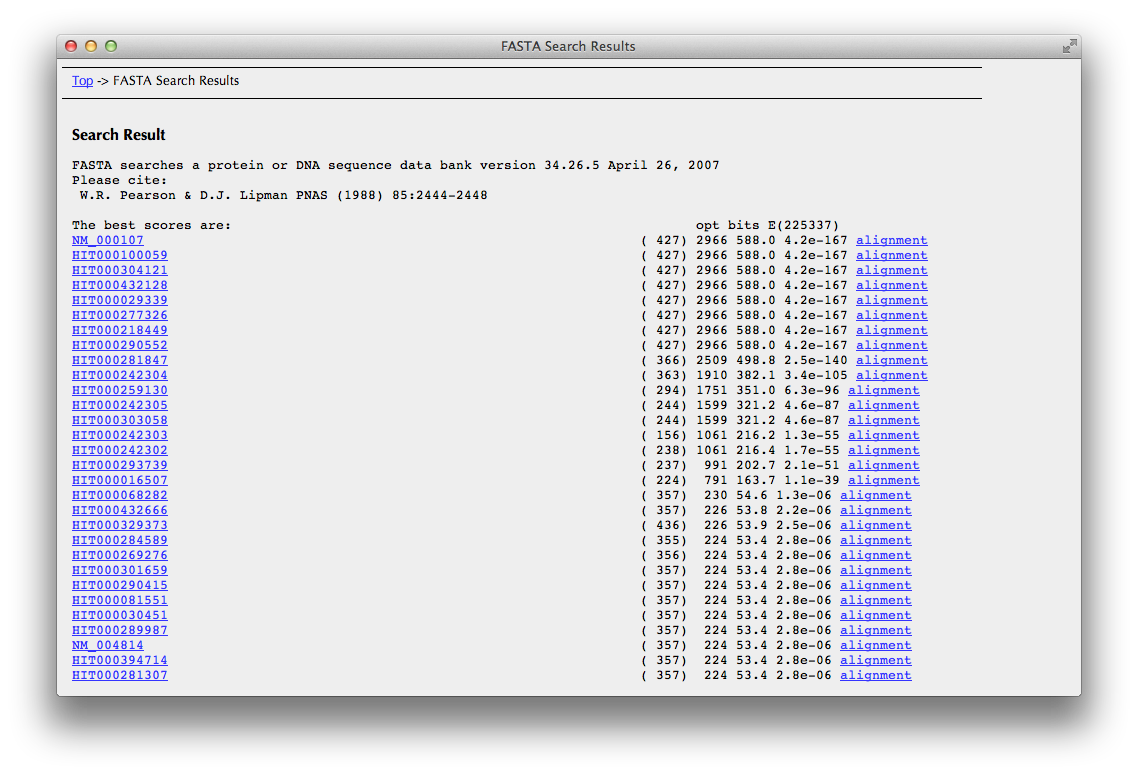
You can see here a list of transcripts found by FASTA search.
Click one of transcript IDs in the leftmost column to go the "Search Result" page.
If you would like to check sequence alignments, click "alignment" in the rightmost column.
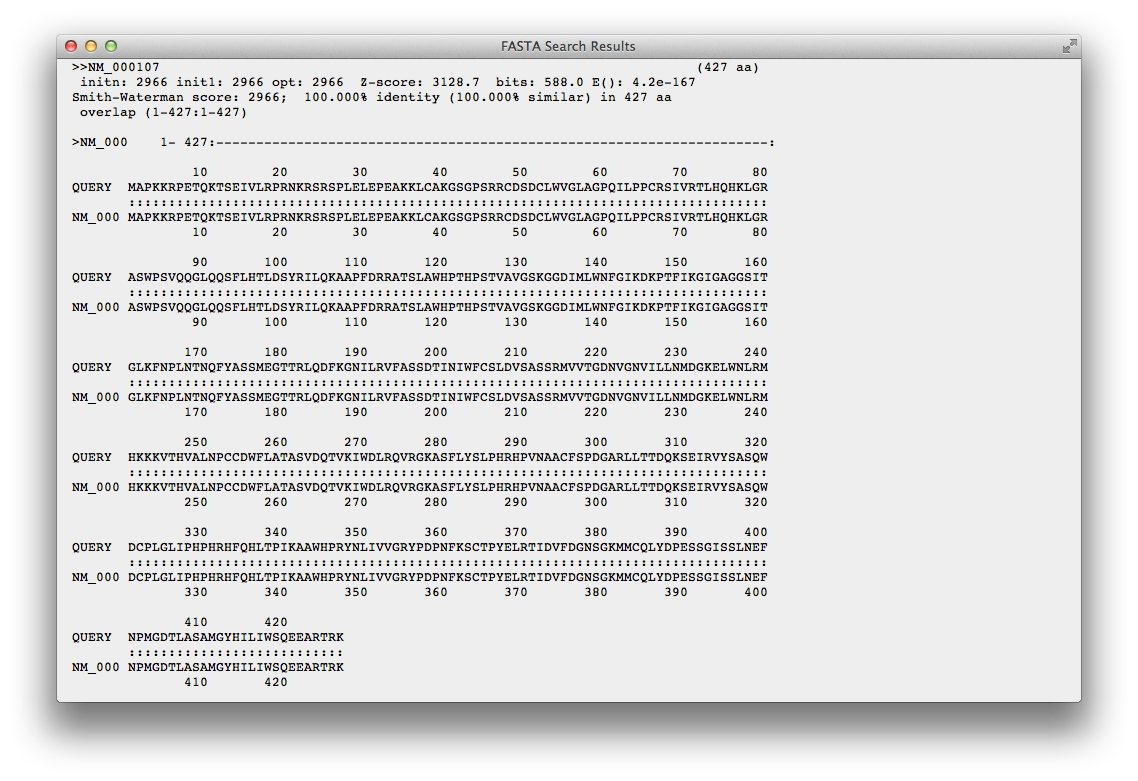
You can see here an alignment between your query sequence and a sequence picked up from this database by FASTA search.
"Transcript details" Page
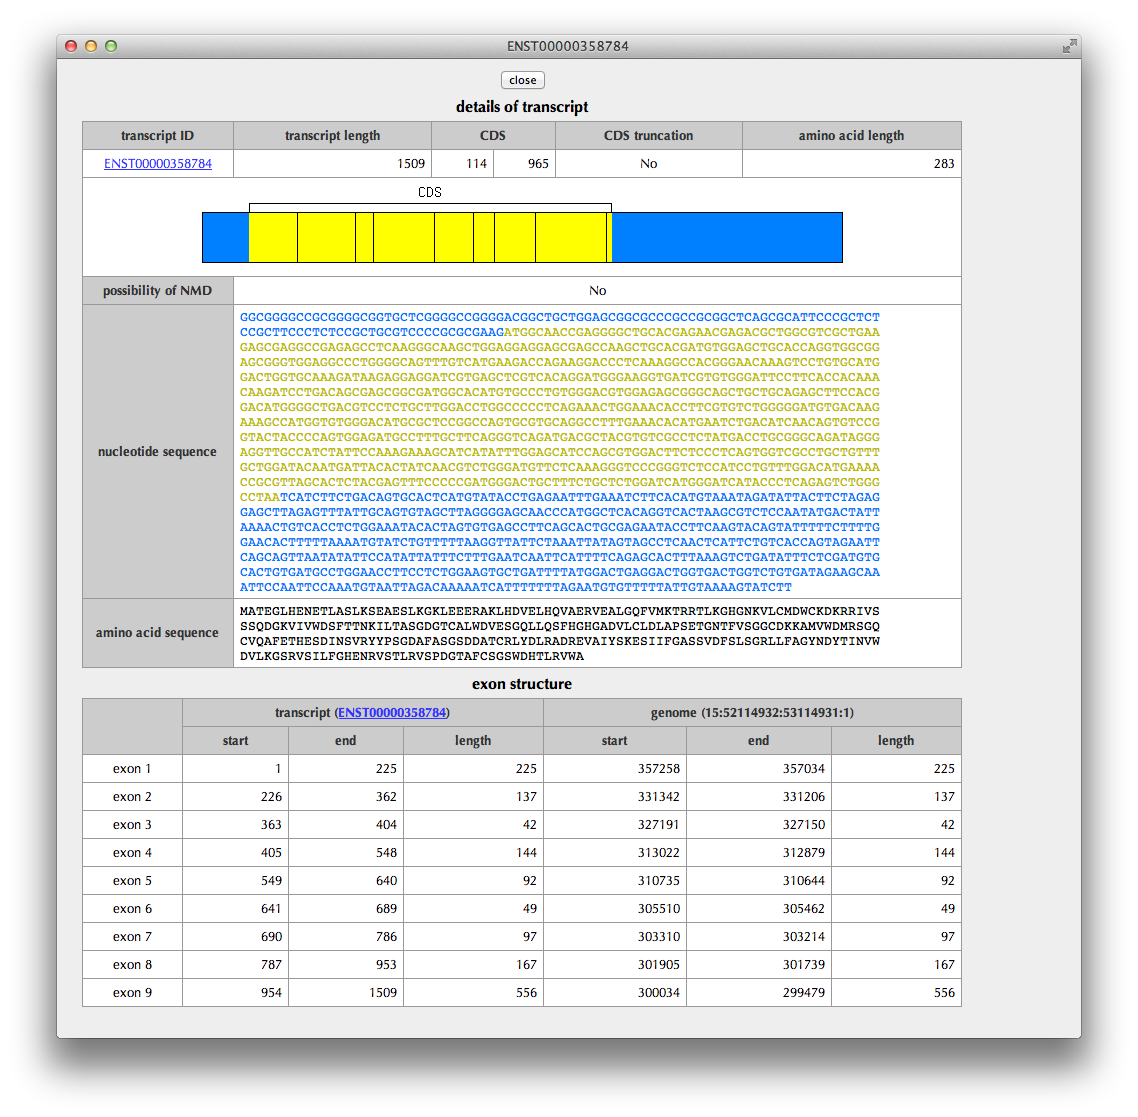
This page shows details of the transcript: the region of CDS (coding sequence), the status of CDS truncation at the 5’ and 3’ termini, a possibility of NMD (nonsense-mediated mRNA decay) judged from the sequence, the nucleotide sequence of transcript, the translated amino acid sequence and the exon structure.
Go back to the explanation of "Transcript cluster" page.
"AS pattern" Page
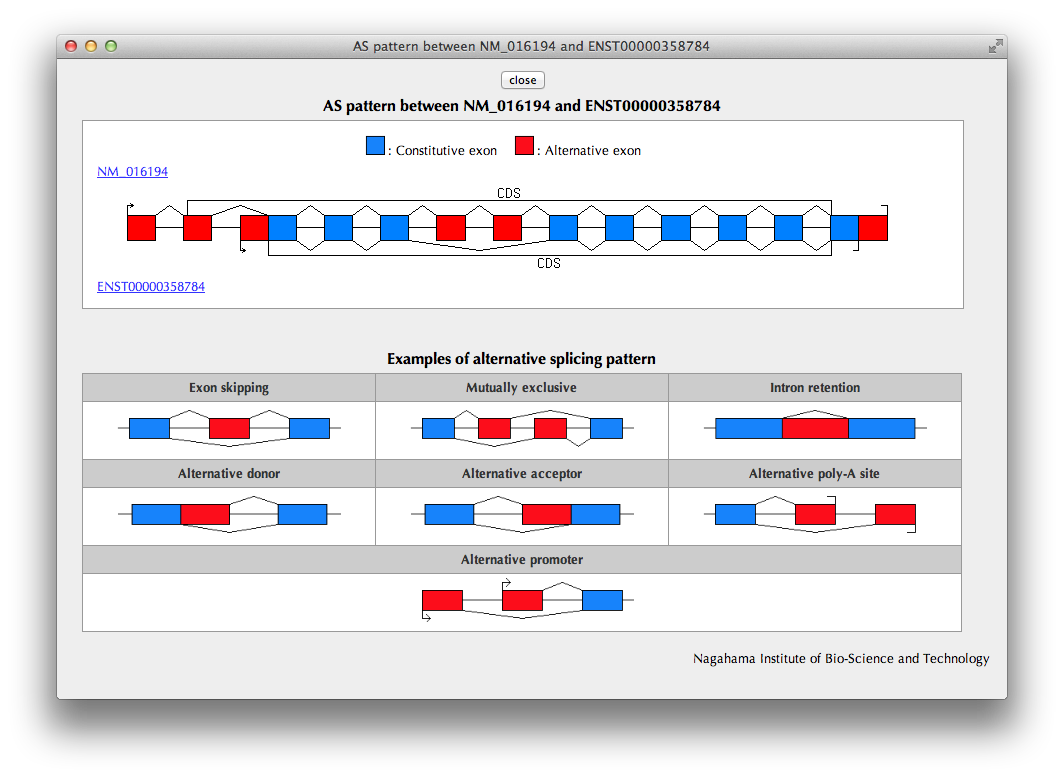
A pattern of alternative exon usage ("AS pattern") of the variant transcript in comparison with the reference transcript selected by the user in the previous page is schematically shown.
A catalog of AS patterns is shown below for your reference.
Go back to the explanation of "Transcript cluster" page.
"Details" Page
Interaction residues with other molecules or hydrophobic core residues included in a relevant AS region are colored by its type (deletion: red, insertion: cyan, substitution: violet).